NSU Newsroom
SharkBytes
Horizons
This version of NSU News has been archived as of February 28, 2019. To search through archived articles, visit nova.edu/search. To access the new version of NSU News, visit news.nova.edu.
This version of SharkBytes has been archived as of February 28, 2019. To search through archived articles, visit nova.edu/search. To access the new version of SharkBytes, visit sharkbytes.nova.edu.
Let’s Get Physical (with Data)
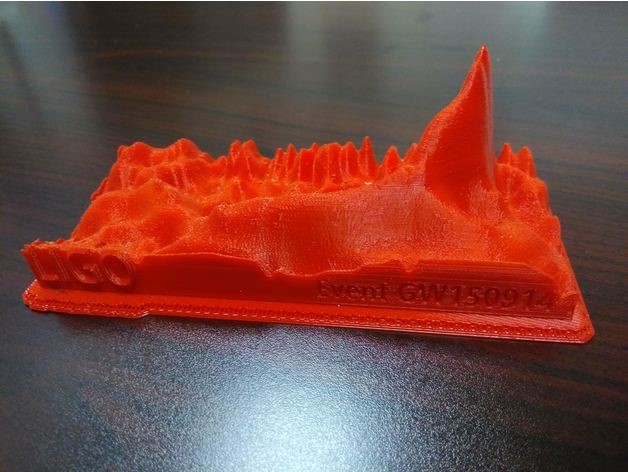
3D-Printed spectrogram of gravity waves created by two black holes coalescing, as observed by the LIGO experiment.
We are surrounded by torrents of data, coming from scientific, industrial, financial, and other sources. To help make sense of complicated information – often involving relationships between three or more variables, NSU associate professor Louis R. Nemzer wants us to get physical with our data, using 3D-printing. In contrast with graphs on a flat paper or computer screen that merely simulate depth, physical 3D-printed models can be held, rotated, inspected, and touched to facilitate a deeper understanding of the data. He has experimented with many types of data, including the GDP of US metro areas, the electronic band structure of graphene, a simulated EEG of a network of neurons, a financial yield curve, quantum probability densities, mathematical functions, and astronomical data. Professor Nemzer has found that spectrograms, which plot a wave’s intensity as a function of time and frequency, are particularly well-suited for 3D-printing. He has designed and printed spectrograms of Neil Armstrong’s famous “One small step for man…” as well as the infamous and controversial “Laurel/Yanni” soundbite that divided the internet in May of 2018. Recently Prof. Nemzer submitted a spectrogram of gravity waves detected by the LIGO experiment to the Dataphys.org “List of Physical Visualizations and Related Artifacts.” Gravity waves are ripples in Spacetime predicted by Einstein’s theory of General Relativity. The LIGO team released a 2D spectrogram from two massive black holes colliding, showing how the intensity of the gravity waves at different frequencies changed over the course of the event. The coalescing of the black holes involved a “ringdown” increase in intensity of the high-frequency components as they spiraled together faster and faster. By converting the data into a physical 3D-printed model, the peak becomes more apparent, and the primary signal, as well as the background noise, are much easier to appreciate. Dr. Nemzer shares this and many other designs for anyone to download and print on the free Thingiverse repository.
http://dataphys.org/list/gravity-wave-spectrogram-ligo/